Juju is an application modelling tool,
enabling “model-driven operations”. I won’t go into detail about
what Juju is in this blog post, so if you’re new to Juju I suggest
clicking on the link and reading a bit more.
Juju is a distributed application, with a “controller” cluster that
manages cloud resources (machines, networks, volumes, etc.), and
applications that use those resources. The controller cluster is
currently based on top of MongoDB, utilising replica sets for data
replication and leadership election.
As well as the controller cluster, Juju agents run on every virtual
machine that the controller manages. The controllers, and those agents,
each run many fine-grained, but dedicated “workers”. For example,
each agent runs a worker to detect block devices and publish that
information to the controller cluster; each controller runs a worker
to maintain the replica sets in MongoDB.
Many things can go wrong in a distributed system. Network partitions
can cause system-wide failures. Bad actors (badly written; less often,
malicious) may starve others of resources. Failure to release memory
or file handles leads to exhaustion, causing a DoS. Juju has seen its
fair share of each of these problems.
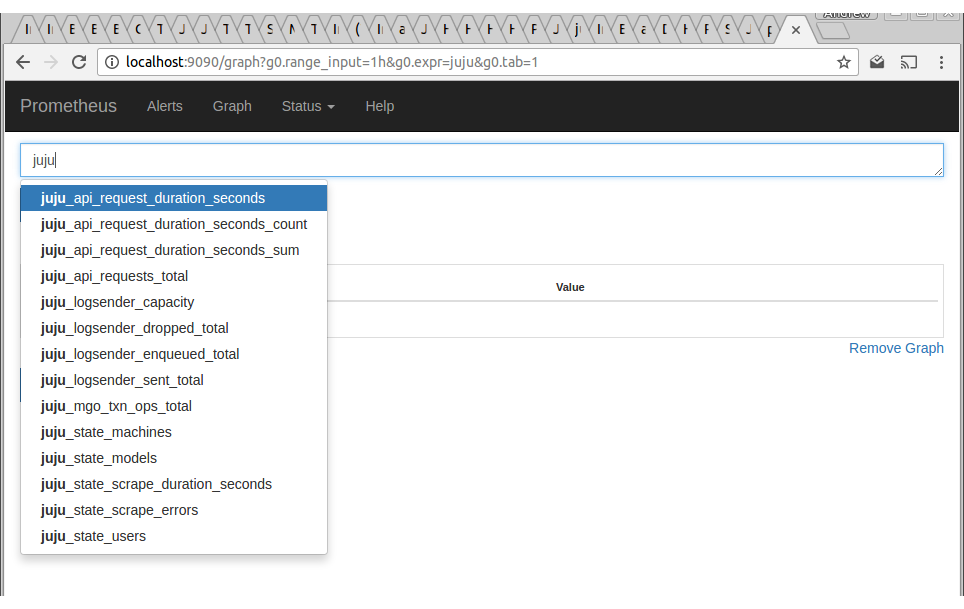
To combat such issues, we have recently added Prometheus monitoring to
Juju. As of Juju 2.1, Juju controllers and agents will export Prometheus
metrics. There are two ways to get at them:
- (on controllers) an HTTPS endpoint, https://…:17070/introspection/metrics.
- (on Linux agents) an abstract domain socket, @jujud-machine-<machine-ID>
Configuring Prometheus to scrape Juju controllers
To configure Prometheus to scrape metrics from Juju controllers, you will
need to add a new scrape target to Prometheus. The metrics endpoint requires
authorisation, so you will need to configure a user and password for
Prometheus to use:
$ juju add-user prometheus
$ juju change-user-password prometheus
new password: <password>
type new password again: <password>
For this new “prometheus” user to be able to access the metrics endpoint,
you must grant the user read access to the controller model:
$ juju grant prometheus read controller
This gives the prometheus user just enough permission to read information
on the controller, without allowing it to make changes, which would not
be ideal for a monitoring application.
Juju serves the metrics over HTTPS, currently with no option of degrading
to HTTP. You can configure your Prometheus to skip validation, or you can
store the controller’s CA certificate in a file for Prometheus to verify
the server’s certificate against:
$ juju controller-config ca-cert > /path/to/juju-ca.crt
We can now add a scrape target to Prometheus. Modify prometheus.yml, adding
the following scrape target:
scrape_configs:
  job_name: juju
    metrics_path: /introspection/metrics
    scheme: https
    static_configs:
      targets: ['<controller-address>:17070']
    basic_auth:
      username: user-prometheus
      password: <password>
    tls_config:
      ca_file: /path/to/juju-ca.crt

Configuring Prometheus to scrape Juju agents
To expose the metrics of agents, you can deploy the juju-introspection
charm onto that agent’s machine. For example, on machine 1, you would
run:
juju deploy ~axwalk/juju-introspection --to 1
The metrics of that agent can then be obtained via:
http://<machine-1-address>:19090/agents/machine-1/metrics
Note that this is not an officially supported charm. The code for it is available at: